Options:
1) Find some help on this page.
2)
View
a poster created using this study.
3)
Try it:
Step-by-Step Instructions.
|
Detector Performance Study
|
|
The main objective of the system performance study is to understand the quality of the data. In order to
believe in any science results from the analysis, one must first confirm that the detector performs reliably over time.
We measure the length of time the photomultiplier tube
responds to a muon and count the number of muons for each value.
A data set that has a lot of muons with short response times and only a few muons with longer times may indicate a noisy counter.
We create a histogram of the number of events (muon hits) as a function of time over threshold (ToT)
to evaluate data in the performance study.
Figure 24(a) below shows the ideal, Gaussian distribution
about a mean value for ToT. Figure 24(b) shows an actual data run plot, which peaks around 12 ns (which is typical for the 1/2 inch thick scintillator,
the PMT efficiency, and threshold settings used in our experiment).
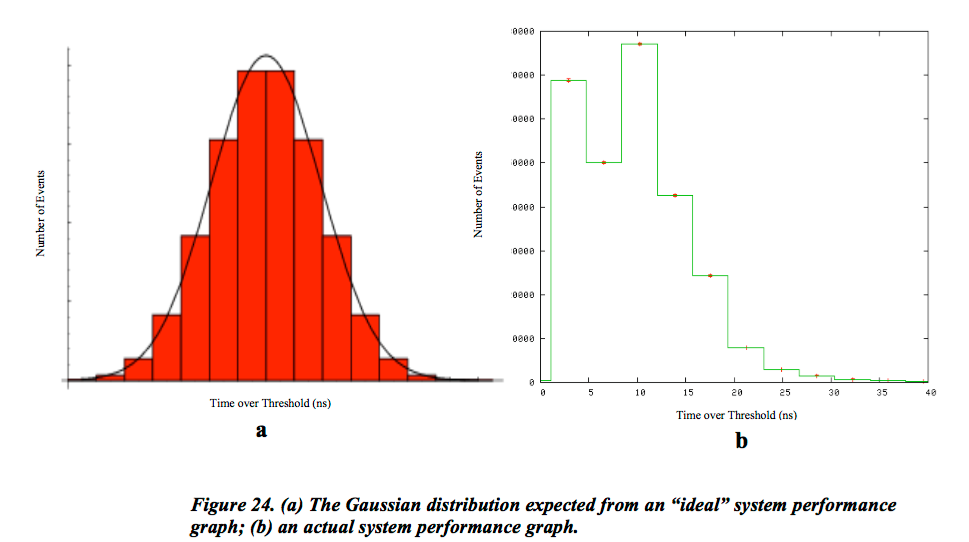
The actual data, however, appears more skewed than Gaussian. This histogram may tell us that there is good data in our actual run data,
but that it is contaminated with short pulses (a.k.a. noise) that were just above threshold. Increasing the threshold value may clean-up this channel in the future.
When plotting a histogram, one can modify the number of bins into which the data are divided. Choosing a different number of bins for the same dataset can
significantly change the shape of the graph and may help evaluate the quality of the data.
|
|
Inspect these plots. Which one shows a counter with an enormous number of
short signals? Which two counters have similar performance? What would you
do if you owned these four counters?
|
 |
|
 |
| |
|
|
 |
|
 |
|
For more background information, see how the detector works.
Figure 24(a) is used with permission. Eric W. Weisstein. "Gaussian Distribution."
From MathWorld--A Wolfram Web Resource.
|
|
Tutorial Pages: 1 2 3 & Analysis
|
